- Research
- Open access
- Published:
Portfolio diversification benefits before and during the times of COVID-19: evidence from USA
Future Business Journal volume 9, Article number: 26 (2023)
Abstract
This paper investigates the portfolio diversification benefits for Islamic and conventional investors in the USA with its major trading partners (United Kingdom, Canada, China, Japan, Malaysia, and Turkey) before and during the COVID-19 crisis period. Using daily data from 2007 to 2020, we employ three relevant time-varying and timescale-dependent techniques, the continuous wavelet transform (CWT) analysis, the wavelet multiple correlation (WMC), and the wavelet multiple cross-correlation (WMCC). The findings suggest that conventional and Islamic US investors who invest with major trading partners may reap large diversification benefits for very short investment horizons (4–8), except for Sharia Malaysia index. However, they may not reap benefits for investment horizons of 8–16 and longer, except for China. In addition, COVID-19 crisis caused a poor diversification opportunity for US investors regardless of the regime they follow (conventional or Islamic). Moreover, the American industrial market depicts a state of impending perfect market integration. Finally, the UK and Canada seem to be the potential market leaders in different wavelet scales. These findings yield important policy implications.
Introduction
The international financial sector has been struck by a new event that has amply affected the portfolio investment business. The spread of the COVID-19 pandemic has generated to a real economic slump in the world. Faced with this perilous situation, most governments have imposed quarantines, containment measures, closures of restaurants, factories, educational institutions, stores, travel bans, deferral of dues and taxes, resilience of banks to contain the virus. This has undeniably blocked most of the commercial activities of the affected countries. The COVID-19 pandemic also caused a real significantly deteriorates of international financial markets. Specifically, it caused high volatility in the US stock market compared to other epidemics of contagious diseases, including notably the Spanish flu. [1, 2].
The COVID-19 pandemic has caused significant disruptions in various industries, leading to market volatility and significant losses for investors. As a result, many investors are reevaluating their investment strategies and seeking ways to mitigate risk. One strategy for mitigating risk is portfolio diversification, which involves investing in a variety of assets to reduce the impact of market fluctuations on the overall portfolio. However, the effectiveness of portfolio diversification during the COVID-19 pandemic remains unclear. Therefore, investigating the impact of the pandemic on portfolio diversification and its effectiveness in mitigating risk is a crucial area of research. The paper can contribute to the literature by examining the impact of COVID-19 on portfolio diversification strategies and the effectiveness of various diversification techniques in reducing the impact of the pandemic on investment portfolios. The study can also provide insights into the behavior of different asset classes during the pandemic, enabling investors to make informed decisions on their investment strategies.
Specifically, we analyze the benefits of portfolio diversification before and during the COVID-19 period. Portfolio optimization issues have been at the center of a theoretical and empirical debate in international financial markets since the 1950s. This debate is based on the implementation of an optimal portfolio strategy, which requires the trade-off between maximizing investment returns and minimizing investment risk [3]. Several factors have contributed significantly to the dramatic evolution of international stock markets. International investors should be vigilant to the increasing integration that is happening between the different stock markets of the world. They are then required to have diversified securities or a portfolio, thus supporting risk reduction [4]. The excessive interconnectedness between stock markets is caused by the presence of high correlations between stock markets in portfolio diversification theories. Therefore, this is likely to prevent investors from taking advantage of diversification benefits. As a result, maximizing portfolio diversification benefits requires the presence of low correlations in price behavior. However, successful diversification strategies require more than investors and portfolio managers considering the interdependence of international stock markets. It requires the consideration of different investment horizons throughout the investment period. Indeed, the variation in market returns is not exclusively viewed over time. It is also perceived in terms of time scales attached to different investment horizons [5].
According to the portfolio management literature, conventional finance aims at optimizing the risk-return trade-off of an investment. However, in Islamic finance, profitability is not seen as the only and primary objective of Islamic principles. In classical Islamic jurisprudence, based on the principles of the Sharia, financial transactions are aimed at improving global economic efficiency, while requiring strict screening of commercial and financial activities [6].Footnote 1 Several empirical studies have shown that Islamic stock indices, in some emerging countries are less risky and partially protected against financial crashes, thus constituting a viable alternative source, for investors who wish to benefit from the diversification advantages (see among others, [7,8,9,10].
Our contribution in this paper focuses on two key areas. Firstly, we analyze the effectiveness of portfolio diversification for US investors (Islamic and conventional) and their trading partners during the COVID-19 pandemic using the continuous wavelet transform (CWT) analysis to specify the degree of correlation with both time and frequency changing. Specifically, we examine the impact of the pandemic on various asset classes and assess the effectiveness of diversification strategies in mitigating risk. Secondly, we introduce the use of wavelet multiple correlation (WMC) to measure the degree of integration between different asset classes, providing a more comprehensive analysis of the relationships between assets. Additionally, we use wavelet multiple cross-correlation (WMCC) to identify the market leader among different asset classes, enabling investors to make informed decisions on their investment strategies. Overall, our contribution offers new insights into the effectiveness of portfolio diversification during the COVID-19 pandemic and provides a more robust analysis of the relationships between different asset classes, enabling investors to make more informed decisions. To do so, we use the Dow Jones conventional and Islamic indices as a proxy for the US stock index. Our results show that conventional and Islamic US investors who invest with major trading partners may reap large diversification benefits for very short investment horizons (4–8), except for Sharia Malaysia index. However, they may not reap benefits for investment horizons of 8–16 and longer, except for China. Specifically, COVID-19 crisis caused a poor diversification opportunity for US investors regardless of the regime they follow (conventional or Islamic). Moreover, the American industrial market illustrates an expected state of full market integration. Finally, the UK and Canada seem to be the potential market leaders in different wavelet scales.
In sum up, previous studies have provided important information on the portfolio diversification issue. Therefore, our paper aims to answer three main questions: first, does geographic diversification benefit US investors? Second, how does the COVID-19 crisis affect portfolio diversification opportunities for US investors? Third, how integrated is the US stock market and who is the US industrial market leader?
The rest of this document is structured as follows. Section "Literature review" is devoted to the presentation of the literature review. Section "Methodology" discusses the research methodology. The empirical results are presented in Sect. "Data and empirical results". Section "Conclusions and implications" concludes with some remarks and recommendations.
Literature review
Theoretically, the portfolio diversification issue is often explained by two main theories: (i) modern portfolio theory and (ii) efficient market hypothesis. Under modern portfolio theory, each security carries its own risk. A portfolio composed of different securities with low or negative correlation between them has a lower risk than the weighted average of the risks of the different securities. The main result of modern portfolio theory is that the risk weight of a portfolio should be lower than the average of the risk weights of the securities in it. This situation is likely to generate optimal diversification [3]. Under efficient market hypothesis, the perfect market transmits precise signals for a better allocation of resources. This is likely to help investors make their investment decisions, while based on the transparency and availability of information on securities prices [11].
The connection between international stock market linkages has been the subject of several empirical studies, largely confirming these theories. In addition, these studies have used different estimation methods. Therefore, this paper highlights a brief overview of this subject by referring to some previous studies. More specifically, we classify these studies according to the econometric techniques most frequently used in the literature. The ARDL model and the co-integration method have been extensively used by several researchers to examine the correlation between stock returns at the international and regional level (e.g., [12,13,14,15,16,17]. However, these different econometric techniques have not taken into consideration the time-varying correlations. They also ignored the different investment horizons over time.
This is likely to keep the literature on the existing relationship between stock markets very limited. To overcome these shortcomings, some empirical studies have recently been published on this topic, taking into account time-varying correlations and scale-dependent correlations. To do so, they have used more sophisticated econometric methods. First, several studies employed the Dynamic Conditional Correlation models (DCC-MGARCH) in order to detect the presence of time-varying correlations, i.e., whether there are correlations between different periods in the stock markets (e.g., [7, 8, 10, 18,19,20]. Second, some empirical applied the CWT to jointly examine co-movements and lead-lag effects between two stock markets in the time and frequency domain, i.e., to assess the time variation and scale variation in co-movements between two stock markets (e.g., [7, 9, 21,22,23,24]. More specifically, other papers used wavelet-based quantile-on-quantile approach [25, 26], and spillover index [25, 26]. Third, other several studies employed the MODWT approach to provide insights on the analyzed markets volatility in the time–frequency domains (e.g., [7, 27, 28]. Finally, other studies employed the WMC and WMCC to analysis the integration between stock markets and to specify the leader of the market (e.g., [22, 29, 30].
Methodology
In this paper, we employ three econometric methods to examine the portfolio diversification benefits for Islamic and conventional investors in the USA with its major trading partners. The first method is the continuous wavelet transform (CWT) analysis. This approach has been applied by several studies in finance and economics research.Footnote 2 The CWT traces the original time series. It transforms it from a function with a single variable separated in time into a function with two different variables. These two variables include time and frequency. In addition, the CWT method allows the correlations of the series to be plotted in a two-dimensional diagram that helps to identify and interpret patterns or hidden information. The correlation between two CWTs is referred to as wavelet coherence. These plots specify the degree of correlation between two variables as a function of time and frequency. Daubechies [39] proposes the least length-asymmetric wavelet filter (denoted LA (8)). This filter consists of eight nonzero coefficients. The filter of length L = 8 is considered as a moderate length. The length filter is adequate for dealing with the characteristics of time series data [5, 40]. In addition, the wavelet coefficient generated by LA (8) is smoother than that of other filters such as the Haar wavelet filter [40]. According to Rua & Nunes [41], the continuous wavelet transform is expressed as follows:
where u reflects the position of the wavelet in the time domain, and s represents the position in the frequency domain. From this information on time and frequency can be obtained together. This is achieved by transforming the original time series into a function of u and s in the wavelet transform.Footnote 3
The coherence of the wavelets is illustrated by a contour plot, where the horizontal axis indicates time, while the vertical axis corresponds to the frequency component (converted into units of time of days). By assessing the degree of co-movements, the coherence changes from blue (low coherence) to red (high coherence). The black area in the coherence graphs is the one that is statistically significant at the 5% significance level. It is estimated from a Monte Carlo simulation. Therefore, cross-wavelet coherence can investigate the different characteristics of the correlation between the index returns in the time–frequency domain. In addition, the dotted arrows indicate the phase difference in the wavelets. This is likely to provide information about the lead/lag relationship in time–frequency space.
The left (\(\to\))/right (\(\leftarrow\)) arrows indicate that the two-time series under consideration are in-phase and anti-phase, respectively. In-phase and anti-phase phenomena represent positive and negative co-movements, respectively. The upward (\(\uparrow\)), right-upward (\(\nearrow\)) and left downward (\(\swarrow\)) arrows represent the first time series leads the second one. Similarly, the downward (\(\downarrow\)), right-downward (\(\searrow\)) and left-upward (\(\nwarrow\)) arrows indicate the first time-series tends to follow the lead of the second series (e.g., [22, 42].
The second and third techniques are the Wavelet Multiple Correlation and Wavelet Multiple Cross-Correlation. Fernández-Macho [29] developed these techniques to overcome a few of the limitations of pairwise and cross-correlations. For simplicity, the WMC is calculated as:
where \(P_{j}^{ - 1}\) is the correlation matrix of the wavelet coefficients (\(W_{{{\text{jt}}}} = \left( {w_{{1{\text{jt}}}} , \cdots ,w_{{{\text{njt}}}} } \right)\)). They coefficients are defined for the respective scales \(\lambda_{j}\) for a multivariate stochastic process \(X_{t} = \left( {x_{1t} , \cdots ,x_{{{\text{nt}}}} } \right)\) to each of the \(x_{it}\) (\(i = 1 \cdots n\)) process.Footnote 4 In theory, the WMC may be defined as:
where the wavelet variances \(\left( {{\text{Var}}\left( {w_{{{\text{ijt}}}} } \right)} \right)\) and co-variances \(\left( {{\text{Cov}}\left( {w_{{{\text{ijt}}}} } \right)} \right)\) are examined by: \({\text{Var}}\left( {W_{{{\text{ijt}}}} } \right) = \overline{\delta }_{j}^{2} = 1/T\;_{j} \sum\nolimits_{{t = :j^{ - 1} }}^{T - 1} {W_{{{\text{ijt}}}}^{2} }\); \({\text{Var}}\left( {\hat{W}_{{{\text{ijt}}}} } \right) = \overline{\xi }_{j}^{2} = 1/T\;_{j} \sum\nolimits_{{t = :j^{ - 1} }}^{T - 1} {\hat{W}_{{{\text{ijt}}}}^{2} }\); \({\text{Cov}}\left( {W_{{{\text{ijt}}}} ,\;\hat{W}_{{{\text{ijt}}}} } \right) = \hat{\gamma }_{j}^{2} = 1/T\;_{j} \sum\nolimits_{{t = :j^{ - 1} }}^{T - 1} {W_{{{\text{ijt}}}} ,\;\hat{W}_{{{\text{ijt}}}} }\) [5].
Following Fernández-Macho [29], the WMCC is calculated as:
The methodology of CWT, WMC, and WMCC is particularly useful for analyzing signals or time series data that have non-stationary properties, meaning their statistical properties vary over time. The CWT allows for the decomposition of a signal into different frequency components, while retaining the time information. This allows for the identification of local patterns and variations in the signal that may not be apparent when looking at the signal. The CWT can also be used to filter out certain frequency components or noise from the signal, making it a valuable tool in signal processing [41, 42] and [22]. WMC measures the correlation between multiple time series, considering the non-stationary properties of the data. This is achieved by decomposing each time series using CWT, and then computing the correlation coefficients between the corresponding components at each scale. WMC can be used to identify common patterns or relationships between multiple time series, even if they have different time scales or underlying trends. Hence, as early mentioned, it is used to measure the degree of integration between different asset classes [29]. WMCC is an extension of WMC that measures the cross-correlation between multiple time series, again considering the non-stationary properties of the data. This is achieved by computing the wavelet coherence between each pair of time series, which measures the degree to which they share common frequency components. WMCC can be used to identify causal relationships between multiple time series, even if there are lags or delays between them. Thus, as early mentioned, it employed to identify the market leader among different asset classes [29].
Data and empirical results
Data
In this study, the Dow Jones conventional and Islamic indices returns are used as a proxy for the US stock index returns which is the principal Conventional and Islamic benchmark indices of the US stock exchange. In addition, we use the principal trading partners of United States which are from United Kingdom, Canada, China, Japan, Turkey, and Malaysia. The choice of this index, as mentioned above, depends mainly on the largest single-point drop in history for the Dow Jones, which fell 2,997.10 on March 16, 2020. The list of the indexes and their respective tickers are in Table 1.
All the data comes from Thomson-Reuters Datastream database. These indexes are transformed to market returns by computing the natural logarithmic differences of the daily closing prices (\({\text{ln}}(p_{t} ) - {\text{ln}}(p_{t - 1} )\)). The closing prices are collected during the period from 26th November 2007 to 19th Mars 2020, covering 3195 trading days. There are several reasons why this particular time period may have been chosen. First, it is possible that the researchers chose the sample period of 26th November 2007 to 19th March 2020 in order to capture two significant crises that had a major impact on financial markets: the global financial crisis of 2008 and the COVID-19 pandemic. The global financial crisis of 2008 was a significant event that had a major impact on financial markets around the world. It began in late 2007 and continued through 2008 and beyond. By selecting a sample period that includes the period leading up to the financial crisis, as well as the crisis itself and its aftermath, the researchers may be able to capture the full impact of the crisis on financial markets. Similarly, the COVID-19 pandemic, which began in early 2020, had a significant impact on financial markets. By including data from the beginning of the pandemic through March 2020, the researchers may be able to capture the initial impact of the pandemic on financial markets. Comparing the two crises could also be a reason for selecting this time period. The researchers may be interested in analyzing how the two crises differ in terms of their impact on financial markets, or in identifying similarities or patterns between the two crises. The plots are presented in Fig. 1.
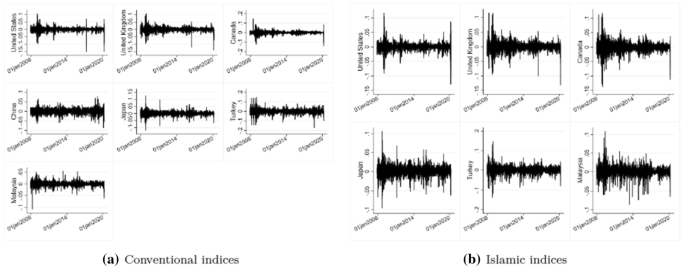
Source Author’s own computation
Returns series plot of conventional and Islamic Dow Jones indices (DJUS, DJUK, DJCA, DJCH, DJJA, DJTUR, and DJMA & DJIUS, DJIUK, DJICA, DJICH, DJIJA, DJITUR, and DJIMA).
Table 2 provides a summary of the descriptive statistics for all the indices used in this study. According to this table, the increase in standard deviation value indicates the existence of increased volatility of returns for the conventional Dow Jones US index. However, this volatility remains the lowest for US Islamic returns. Moreover, with the exception of the Dow Jones Conventional Canada returns, the presence of skewness was detected for all other returns. This asymmetry proves the existence of high risks. Moreover, the results of the normality test show that the kurtosis values are greater than three are. This translates into the fact that the returns of the conventional and Islamic indices are not normally distributed, also showing the existence of high risks. Similarly, referring to the results of the Jarque–Bera test, it can be noted that the distribution is not normal, as all returns of the conventional and Islamic indices are significant. This shows the severity of the variability and risk of the returns of the conventional and Islamic indices, which are significant.
Estimation using the CWT analysis
The results obtained from the CWT analysis, based on various investment horizons, will be discussed in this section. Before performing this approach, it was first necessary to test the linearity hypothesis. Figure 2 plots the linear correlation coefficients. These coefficients show a low degree of correlation at the level of the whole sample. However, it should be noted, that linear correlations may not satisfactorily account for nonlinear relationships [22, 43]

Source Author’s own computation
Scatter plots, histograms, and linear correlations of conventional and Islamic Dow Jones indices. Note: ***, **, * represents those linear correlations are significant at 1% 5%, and 10% levels, respectively.
To remedy this problem, we use the BDS test on the residuals of the AR(1) process for the returns of the conventional and Islamic DJ indices [22, 44]. The null hypothesis of this test is independent and identical distribution (i.i.d). Table 3 presents the BDS test results, indicating that the null hypothesis could not be accepted. This result indicates the risk of unreliability of linear correlation results and the need to perform wavelet-based correlation.
To perform the CWT analysis, we apply the wavelet coherence method mentioned in the above section. Figures 3 and 4 illustrate the results of the CWT analysis and the phase difference between the returns of the US Dow Jones indices (conventional and Islamic) and their counterparts from scale 1 (one day) to scale 5 (1024 days). The horizontal axis indicates time in terms of the number of days of trading, while the vertical axis denotes the investment horizon. For our study, the conventional and Islamic Dow Jones indices in the US are the first series in all wavelet coherence diagrams. The R language was used to perform all kinds of calculations. In this framework, our analysis is based on four main scales, namely very short investment horizons (2–4 and 4–8), short investment horizons (8–16, 16–32 and 32–64), medium investment horizons (64–128 and 128–256) and longer investment horizons (256–512 and 512–1024).

Source Author’s own computation
Continuous wavelet transform-Conventional indices returns. Note: Wavelet coherence maps. Note: The red (blue) colors present the region with high (low) coherency. The coherence power color bar indicates the power of coherence coefficients. The black contour presents the 5% significance level estimated from Monte Carlo Simulations.

Source: Author’s own computation
Continuous wavelet transform-Islamic indices returns. Note: Wavelet coherence maps. The red (blue) colors present the region with high (low) coherency. The coherence power color bar indicates the power of coherence coefficients. The black contour presents the 5% significance level estimated from Monte Carlo Simulations.
For the very short investment holding periods (2–4 days and 4–8 days), we note that the correlations are low between all the returns in the Dow Jones U.S indices (conventional and Islamic) and the major trading partners throughout the study period, except for the Islamic Malaysia index. Overall, these low correlations are detected through the coherence diagram which represents the regions in blue and light blue color. Thus, these low correlations generate a low risk, which in turn encourages US investors to invest in the short term. From these results, geographic diversification is a good strategy for US investors in the very short term.
However, we remark that the correlations between the returns of the conventional and Islamic Dow Jones Indices are highly elevated for the short (8–16, 16–32, and 32–64) and medium investment horizons (64–128 and 128–256), which lead a low diversification opportunity. Specifically, these high correlations are mainly a result of the onset and propagation of several financial crises, going through the 2008 financial crisis to the COVID-19 crisis. The financial crisis revealed a large crash in the world stock markets that occurred in October 2008. Specifically, the findings show a high correlation between the returns of US indices (conventional an Islamic) and the returns of United Kingdom indices (conventional an Islamic). This high correlation is also due to the Eurozone sovereign crisis of 2011–2012. In addition, the stock market crash in China, which began on June 12, 2015, caused a high correlation between the return of the Dow Jones index of China and the USA. Moreover, the findings also suggest a high correlation between the returns of the Dow Jones Indices of Turkey and the USA during the period of the Turkish lira crisis of 2018. Finally, we thus find a high correlation between all the returns of the conventional and Islamic Dow Jones Indices of the United States and trading partners during the COVID-19 period. Certainly, this high correlation could reduce the investment opportunities for conventional and Islamic US investors.
Turning to the longer investment horizons (256–512 and 512–1024), we observe a strong correlation between all US conventional and Islamic Dow Jones index returns and the returns of major trading partner indices, especially in 2008 at the time of the financial crisis and the COVID-19 crisis. This high correlation indicates poor diversification opportunities for US investors regardless of the regime they follow (conventional or Islamic). In summary, we explain all these circumstances in more detail in Sect. “Discussions”.
Estimation applying the WMC and WMCC techniques
The CWT results show higher coherences in the returns of the conventional and Islamic US DJ indices. These higher coherences lead us to analysis the integration of the US stock market. Specifically, we investigate the extent to which the US stock market (conventional and Islamic) is integrated. Based on the financial literature, it appears that a highly integrated market is similar to a common investment portfolio. In other words, the advantage of shifting investments from one economy to another is indifferent [22, 29, 36]. Similar to this literature, we apply wavelet multiple correlation analysis to measure the market integration. Table 4 reports the result of WMC.
The WMC results show low correlation coefficients (0.364 for the conventional market and 0.178 for the Islamic market) at wavelet scale 1 (2–4 days) that increase smoothly to 0.998 at the longest horizon of 128–256 days (for both conventional and Islamic US markets). Thus, the findings show that US markets (as measured by the Dow Jones index) are tending toward an optimal level of integration when there are only limited benefits from diversification among their constituent economies. In addition, Fig. 5 plots the data pictorial representation.

Source: Author’s own computation
Wavelet multiple correlation for Dow Jones returns. Note: The blue dashes represent the upper and lower bounds of the 95% confidence interval.
Figure 6 reports WMCC results for different wavelet levels applying the Daubechies less asymmetric filter of length eight. Similar to Polanco-Martínez & Fernández-Macho [45] and Das et al. [22], the cross-correlations are plotted up to one-month lag. Furthermore, the location of the highest correlation can be seen at the longest wavelet scale of 32 for a lag of up to 10 days. Thus, this method allows the identification of potential market leaders in the US. Following Polanco-Martínez & Fernández-Macho [45], the right-hand side of the wavelet scale mappings presents the series that optimizes the cross-correlations with respect to the linear combination of the other considered time series. The results then show that the UK appears to be the eventual market leader at wavelet scales 2, 16 and 32. However, at wavelet scales 1, 4 and 8, Canada appears to be the market leader.

Source: Author’s own computation
Wavelet multiple cross-correlation for Dow Jones indices (conventional and Islamic) returns. Note: The white parts show the parts where the 95% interval is equal to zero. The long vertical dashed lines show the area with the most significant correlation between the wavelets. The color band on the right presents the strength of the correlation. For each wavelet correlation, the coefficients are within the 95% confidence interval.
Discussions
Based on the results obtained by the different techniques, we find the presence of several circumstances that could explain the change in the level (having direct effects) of the correlations between the returns of the conventional and Islamic Dow Jones indexes of the United States and the main trading partners. Moreover, the results show a strong correlation between the returns of DJUS indices (conventional and Islamic) and the returns of DJCA indices (conventional and Islamic). These results prove that the Canadian stock index is a risky investment for U.S. investors. This could be attributed mainly to the great increase in trade activity between these two countries when comparing to other trading partners. According to Trade (2019), Canada remains the main trading partner of the United States, as bilateral trade between the two countries recorded 612.4 billion in December 2019.
Analyzing the correlation between the returns of the US indices (DJUS and DJIUS) and those of Turkey (DJTUR and DJITUR), we find overall a low correlation, except for the period of the financial crises especially the Turkish lira crisis of 2018. In fact, this period was marked by a massive increase in inflation rates (with an annual inflation rate of around 13% for 2018) and a cut in key interest rates implemented by the Turkish regulatory authority. This situation is mainly the result of trade threats between Turkey and the USA. In this case, the Turkish lira loses almost half of its value on August 13, 2018, from 3.5 lira to 1 dollar to 7.5 lira to 1 dollar. This decrease generated therefore to a strong association between the returns of the indices of two countries.
Relating to the medium investment horizons (64–128 and 128–256), correlations were high between the US and the Asian trading partner (Malaysia and Japan). These results are consistent with those found by Rahim & Masih [7]. The authors concluded that the markets in Malaysia and Japan were evolving toward greater integration. This was clearly observed after the 1997 financial crisis. Specifically, there is a relatively strong correlation between the returns of the US indices (DJUS, DJIUS) and those of Malaysia (DJMA and DJIMA). Therefore, if traditional US investors decided to invest in Malaysia, diversification benefits could be generated when investing at shorter time periods than 8–16 days. However, US Islamic investors do not benefit from diversification if they invest in Malaysia during all investment horizons.
The low correlation between the returns of the U.S. (DJUS and DJIUS) and China (DJCH and DJICH) indices that is observed during for almost all investment horizons is explained by commercial relationship. Indeed, China is considered the largest trading partner in terms of imports for the USA with 452.2 billion. This shows an increase in trade activity between the two countries. However, the market crash in China, which began on June 12, 2015, by the ricochet of the US stock markets, leads to a high correlation between the returns of these indices. This period was marked by a drop in the value of stocks on the Shanghai stock exchange (about a the one-third) for a month. In this case, the ability of listed companies to access financing has been reduced, thus hindering their growth. This crash created a financial bubble that began in November 2014. Moreover, in 2018, the increase in customs taxes, resulting from trade disputes, disrupted the financial markets of these countries. Therefore, if US investors were to invest in China, they could realize the benefits of diversification when they do not do so during the average time horizons (64–128 and 128–256). Finally, the COVID-19 crisis did not lead to a significant correlation between the returns of the two countries' indices.
Turning to the WMCC findings, the basic reason for Canada’s emergence as a market leader in the USA is obvious in the North American Free Trade Agreement (NAFTA). Canada and the US trade more than 1 million dollars in goods and services every minute of every day of the year, totaling an estimated 718.4 billion dollars in 2019 (USTR, 2019). Following this agreement, Canada has restructured certain industrial sectors to better integrate its economy with that of the USA In addition, the main reason for United Kingdom’s emergence as a market leader in the USA could be attributed to the spatial relationship between the two countries. Although the UK was the seventh largest trading partner of the USA in 2019 [46], WMCC results suggest that it is the US industrial market leader. These findings could encourage the two countries to conclude a free trade agreement.
Based on these findings, a more important question deserves to be asked: why has the spread of COVID-19 provoked such perverse repercussions on the stock markets since the end of February 2020? To answer on this question, we focus on recent studies with different explanations. According to Baker et al. [2], the current pandemic has serious public health and economic implications. In addition, these authors linked this spread of COVID-19 to several factors such as the severity of the pandemic and the non-negligible increase in mortality rates. In addition, the period of COVID-19 is accompanied by a huge technological development compared to that of the Spanish flu. Therefore, this technological development has been a major factor in the disclosure of reliable information about the COVID-19 pandemic [2]. The most important conclusion reached by the authors is that the effect of the COVID-19 pandemic on the stock markets turns out to be more concentrated in time. This effect is also able to generate a daily jump trigger and high stock market volatility compared to the evolution of the Spanish flu over the last century [2]. A more extensive explanation focuses on the attitude and policy responses to the COVID-19 outbreak situation. Baldwin [47] suggested that the crisis period and the confinement policies of COVID-19 generated a direct and huge reduction in the flow of labor to firms. These policies then led to a dramatic reduction in the production of goods and services. In addition, other factors led to the disruption of financial markets, the most reactive of which was the voluntary adoption of social distancing practices.
Conclusions and implications
Conclusions
This paper investigates the portfolio diversification benefits for investors in the USA with their main commercial partners, both Islamic and conventional (United Kingdom, Canada, China, Japan, Malaysia, and Turkey) before and during the COVID-19 crisis period. To do so, we collected daily time series closing price data for the Dow Jones conventional and Islamic indices returns from November 26, 2007, to March 19, 2020. Similar to previous studies, we employ three econometric methods: CWT analysis WMC, and WMCC. The results of the CWT analysis focused on four main scales namely very short investment horizons (2–4 and 4–8), short investment horizons (8–16, 16–32 and 32–64), medium investment horizons (64–128 and 128–256) and longer investment horizons (256–512 and 512–1024). Regarding the first scale results (2–4 days and 4–8 days), these proved that the correlations are generally low between all the returns of the US Dow Jones Indices (conventional and Islamic) and trading partners during the full period, except for the Islamic Malaysia index. Turning to the second (8–16, 16–32 and 32–64) and third scales results (64–128 and 128–256), these showed that the correlations between the returns of the US Dow Jones Indices (conventional and Islamic) and the major trading partners are highly significant. Finally, except for China, the fourth scale results (256–512 and 512–1024) indicated high correlation between the returns of US Dow Jones Indices (conventional and Islamic) and major trading partners, specifically during the financial and Covid-19 crises. These findings indicate poor diversification opportunities for US investors regardless of the regime they apply (conventional or Islamic).
In addition, the WMC results indicate that the US markets (as measured by the Dow Jones index) are trending toward a point of optimal integration. Finally, the WMCC findings suggest that the UK appears to be the eventual market leader at the 2, 16 and 32 wavelet scales. However, at wavelet time scales 1, 4 and 8, Canada appears to be the market leader.
Certainly, serval conclusions can be drawn from the case study on portfolio diversification benefits in the USA. First, the case study could explore in more depth the specific benefits of portfolio diversification, such as risk reduction, improved returns, and better asset allocation. The study could also discuss how these benefits apply to different types of investors, such as institutional investors, individual investors, and high-net-worth individuals. Second, the study could analyze how different economic conditions affect the benefits of portfolio diversification. For example, during a recession, diversification may provide a greater degree of risk reduction than during a boom period. The study could discuss the benefits of international diversification, including the potential to reduce overall portfolio risk by investing in a broader range of markets and asset classes. It could also examine the challenges and risks associated with international diversification, such as currency fluctuations and political instability. Third, the study could provide practical advice for investors who want to diversify their portfolios. This could include information on how to determine an appropriate asset allocation, how to select diversified investments, and how to monitor and adjust the portfolio over time. Finally, the study could also discuss the limitations of portfolio diversification, such as the fact that diversification does not eliminate all investment risk, and the potential for correlation among different asset classes during times of market stress. Overall, the case study on portfolio diversification benefits in the USA provides a valuable starting point for further discussion and analysis. By exploring the various aspects of portfolio diversification, investors can gain a better understanding of the potential benefits and risks and make more informed decisions about how to structure their investment portfolios.
Practical implications
In terms of policy implications, it is essential to highlight that geographic diversification is an appropriate policy for US investors in very short investment horizons (2–4 and 4–8). However, during the COVID-19 period, this policy is not an appropriate investment for US investors if they are investing in the horizons of 16–32 days and longer. This is because the integration of financial markets could generate risks (a risk of exchange rate volatility, an increase in the rate of inflation, etc.), leading to global shocks. However, during the COVID-19 crisis, conventional US investors investing with Chinese partners may reap large diversification benefits for medium and longer investment horizons. In sum up, American investors and portfolio managers must adopt a sectoral diversification rather than geographic diversification in times of COVID-19 because the pandemic operates in waves. In addition, to take benefit of portfolio diversification, US investors should not invest only in stocks (e.g., include other financial assets) and reassess their investment horizons. Therefore, policymakers need to consider these implications.
Portfolio diversification is a risk management strategy that involves investing in a variety of assets to reduce the overall risk of the portfolio. Empirical analyses have shown that diversification can offer several practical implications and economic benefits, especially during times of economic uncertainty and market volatility. The financial crisis of 2008 highlighted the importance of diversification in investment portfolios. During this period, many investors suffered significant losses due to the high concentration of investments in a few asset classes. However, those who had diversified portfolios with investments in different asset classes, such as bonds and real estate, were better positioned to weather the storm. Similarly, the COVID-19 pandemic has demonstrated the importance of diversification during times of unexpected economic shocks. The pandemic led to significant market volatility, causing many asset classes to suffer losses. However, those with diversified portfolios were able to mitigate their losses by having investments in sectors that were less affected by the pandemic, such as technology and healthcare. Moreover, empirical analyses have shown that portfolio diversification can provide economic benefits such as higher returns and lower volatility. A well-diversified portfolio can provide exposure to a range of assets with different risk and return characteristics, which can lead to better risk-adjusted returns. In addition, events such as changes in interest rates and inflation can also have implications for portfolio diversification. For example, in a high inflation environment, investors may benefit from having exposure to commodities and real estate, which can act as a hedge against inflation. Overall, portfolio diversification is an important strategy for investors to manage risk and maximize returns. By diversifying across different asset classes and sectors, investors can reduce the impact of market volatility and position themselves to take advantage of economic opportunities.
Limits and future research
Finally, boosted by the announcement of a future vaccine on November 8, 2020, the Dow Jones closed sharply up 2.95% at 29,157.97 points. In this case, our study indicates avenues for future research that could examine portfolio diversification benefits after the vaccination period.
Availability of data and materials
We have used secondary sources to complete our study. No new data are used or produced in this study.
Notes
Restrictions, imposed then by Islamic law, such as the prohibition of riba and gharar, subrogation of bank loans by investments in real assets (i.e., Sukuk, Murabaha, Ijara…etc.) and interest charged with profit and loss sharing among stakeholders, are put in place in order to improve economic efficiency.
References
Albulescu CT (2021) COVID-19 and the United States financial markets’ volatility. Financ Res Lett 38:101699
Baker SR, Bloom N, Davis SJ, Kost KJ, Sammon MC, & Viratyosin T (2020) The unprecedented stock market impact of COVID-19. National Bureau of Economic Research
Markowitz H (1952) Portfolio selection. J Financ 7(1):77–91
Khan TA (2011) Cointegration of international stock markets: an investigation of diversification opportunities. Undergrad Econ Rev 8(1):7
Gençay R, Selçuk F, Whitcher BJ (2001) An introduction to wavelets and other filtering methods in finance and economics. Elsevier
El-Gamal MA (2006) Islamic finance. Law, economics, and practice. Cambridge University Press, Cambridge
Rahim AM, Masih M (2016) Portfolio diversification benefits of Islamic investors with their major trading partners: evidence from Malaysia based on MGARCH-DCC and wavelet approaches. Econ Model 54:425–438
Raza N, Ali S, Shahzad SJH, Rehman MU, Salman A (2019) Can alternative hedging assets add value to Islamic-conventional portfolio mix: evidence from MGARCH models. Resour Policy 61:210–230
Rizvi SAR, Arshad S, Alam N (2015) Crises and contagion in Asia Pacific—Islamic v/s conventional markets. Pac Basin Financ J 34:315–326
Trabelsi N, Naifar N (2017) Are Islamic stock indexes exposed to systemic risk? Multivariate GARCH estimation of CoVaR. Res Int Bus Financ 42:727–744
Fama EF (1970) Efficient market hypothesis: a review of theory and empirical work. J Financ 25(2):28–30
Arshanapalli B, Doukas J (1993) International stock market linkages: evidence from the pre-and post-October 1987 period. J Bank Financ 17(1):193–208
Bley J, Chen KH (2006) Gulf cooperation council (GCC) stock markets: the dawn of a new era. Glob Financ J 17(1):75–91
Majdoub J, Mansour W, Jouini J (2016) Market integration between conventional and Islamic stock prices. North Am J Econ Financ 37:436–457
Majid M, Kassim SH (2010) Potential diversification benefits across global Islamic equity markets. J Econ Coop Dev 31(4):103–126
Marashdeh H (2005) Stock market integration in the MENA region: an application of the ARDL bounds testing approach
Wu Y, Jing W, Liu J, Ma Q, Yuan J, Wang Y, Du M, Liu M (2020) Effects of temperature and humidity on the daily new cases and new deaths of COVID-19 in 166 countries. Sci Total Environ 729:139051
Bugan MF, Cevik EI, Dibooglu S (2021) Emerging market portfolios and Islamic financial markets: diversification benefits and safe havens. Borsa Istanbul Rev 22:77–91
Celık S (2012) The more contagion effect on emerging markets: the evidence of DCC-GARCH model. Econ Model 29(5):1946–1959
Saiti B, Bacha OI, Masih M (2014) The diversification benefits from Islamic investment during the financial turmoil: the case for the US-based equity investors. Borsa Istanb Rev 14(4):196–211
Aloui C, Hkiri B (2014) Co-movements of GCC emerging stock markets: new evidence from wavelet coherence analysis. Econ Model 36:421–431
Das D, Kannadhasan M, Al-Yahyaee KH, Yoon S-M (2018) A wavelet analysis of co-movements in Asian gold markets. Physica A 492:192–206
Mariana CD, Ekaputra IA, Husodo ZA (2021) Are bitcoin and ethereum safe-havens for stocks during the COVID-19 pandemic? Financ Res Lett 38:101798
Sun Q, Xu W (2018) Wavelet analysis of the co-movement and lead–lag effect among multi-markets. Physica A 512:489–499
Su C-W, Rizvi SKA, Naqvi B, Mirza N, Umar M (2022) COVID19: a blessing in disguise for European stock markets? Financ Res Lett 49:103135
Su C-W, Yuan X, Umar M, Chang T (2022) Is presidential popularity a threat or encouragement for investors? Econ Res Ekonomska Istraživanja. https://doi.org/10.1080/1331677X.2022.2129409
Reboredo JC, Rivera-Castro MA (2013) A wavelet decomposition approach to crude oil price and exchange rate dependence. Econ Model 32:42–57
Reboredo JC, Rivera-Castro MA (2014) Wavelet-based evidence of the impact of oil prices on stock returns. Int Rev Econ Financ 29:145–176
Fernández-Macho J (2012) Wavelet multiple correlation and cross-correlation: a multiscale analysis of Eurozone stock markets. Physica A 391(4):1097–1104
Kumah SP, Odei-Mensah J (2021) Are cryptocurrencies and African stock markets integrated? Q Rev Econ Financ 81:330–341
Vacha L, Barunik J (2012) Co-movement of energy commodities revisited: evidence from wavelet coherence analysis. Energy Econ 34(1):241–247
Madaleno M, Pinho C (2012) International stock market indices comovements: a new look. Int J Financ Econ 17(1):89–102
Abdullah AM, Saiti B, Masih M (2016) The impact of crude oil price on Islamic stock indices of Southeast Asian countries: evidence from MGARCH-DCC and wavelet approaches. Borsa Istanbul Rev 16(4):219–232
Najeeb SF, Bacha O, Masih M (2015) Does heterogeneity in investment horizons affect portfolio diversification? Some insights using M-GARCH-DCC and wavelet correlation analysis. Emerg Mark Financ Trade 51(1):188–208
Dewandaru G, Masih R, Masih AMM (2016) Contagion and interdependence across Asia-Pacific equity markets: an analysis based on multi-horizon discrete and continuous wavelet transformations. Int Rev Econ Financ 43:363–377
Tiwari AK, Mutascu MI, Albulescu CT (2016) Continuous wavelets transform and rolling correlation of European stock markets. Int Rev Econ Financ 42:237–256
Yang L, Cai XJ, Hamori S (2017) Does the crude oil price influence the exchange rates of oil-importing and oil-exporting countries differently? A wavelet coherence analysis. Int Rev Econ Financ 49:536–547
Sakti MRP, Masih M, Saiti B, Tareq MA (2018) Unveiling the diversification benefits of Islamic equities and commodities: evidence from multivariate-GARCH and continuous wavelet analysis. Manag Financ 44(6):830–850
Daubechies I (1992) Ten lectures on wavelets, Vol. 61 of CBMS-NSF regional conference series in applied mathematics, SIAM: Philadelphia
In F, Kim S (2013) An introduction to wavelet theory in finance: a wavelet multiscale approach. World Scientific, Singapore
Rua A, Nunes LC (2009) International comovement of stock market returns: a wavelet analysis. J Empir Financ 16(4):632–639
Jiang Z-Q, Yang Y-H, Wang G-J, Zhou W-X (2017) Joint multifractal analysis based on wavelet leaders. Front Phys 12(6):128907
Andrieş AM, Ihnatov I, Tiwari AK (2016) Comovement of exchange rates: a wavelet analysis. Emerg Mark Financ Trade 52(3):574–588
Broock WA, Scheinkman JA, Dechert WD, LeBaron B (1996) A test for independence based on the correlation dimension. Economet Rev 15(3):197–235
Polanco-Martínez JM, Fernández-Macho FJ (2014) Package W2CWM2C: description, features, and applications. Comput Sci Eng 16(6):68–78
Commerce (2019a) U.S. Department of Commerce. In U.S. Department of Commerce
Baldwin R (2020) The supply side matters: Guns versus butter, COVID-style. VOX CEPR Policy Portal, 22
Acknowledgements
We thank the editor and the anonymous reviewers for their constructive comments.
Funding
The authors received no specific funding.
Author information
Authors and Affiliations
Contributions
EA contributed in the conceptualization, validation, the design of the work, and writing the original draft. AR supervised project and provided his valuable comments to develop the quality of research. SM reviewed and edited the writing of the manuscript. EOA contributed in the acquisition, analysis, or interpretation of data; the using of statistical analysis in the work, writing the original draft. All authors have read and approved the manuscript. All authors read and approved the final manuscript.
Corresponding author
Ethics declarations
Ethics approval and consent to participate
Not applicable.
Consent for publication
Not applicable.
Competing interests
The authors declare that they have no conflict of interest.
Additional information
Publisher's Note
Springer Nature remains neutral with regard to jurisdictional claims in published maps and institutional affiliations.
Rights and permissions
Open Access This article is licensed under a Creative Commons Attribution 4.0 International License, which permits use, sharing, adaptation, distribution and reproduction in any medium or format, as long as you give appropriate credit to the original author(s) and the source, provide a link to the Creative Commons licence, and indicate if changes were made. The images or other third party material in this article are included in the article's Creative Commons licence, unless indicated otherwise in a credit line to the material. If material is not included in the article's Creative Commons licence and your intended use is not permitted by statutory regulation or exceeds the permitted use, you will need to obtain permission directly from the copyright holder. To view a copy of this licence, visit http://creativecommons.org/licenses/by/4.0/.
About this article

Cite this article
Attia, E.F., Aly, S.M., ElRawas, A.s. et al. Portfolio diversification benefits before and during the times of COVID-19: evidence from USA. Futur Bus J 9, 26 (2023). https://doi.org/10.1186/s43093-023-00205-4
Received:
Accepted:
Published:
DOI: https://doi.org/10.1186/s43093-023-00205-4